Upload date
All time
Last hour
Today
This week
This month
This year
Type
All
Video
Channel
Playlist
Movie
Duration
Short (< 4 minutes)
Medium (4-20 minutes)
Long (> 20 minutes)
Sort by
Relevance
Rating
View count
Features
HD
Subtitles/CC
Creative Commons
3D
Live
4K
360°
VR180
HDR
40,033 results
Take my Full Excel for Data Analytics Course! https://www.analystbuilder.com/courses/excel-for-data-analytics In this video we ...
1,220,755 views
4 years ago
Take my Full Excel for Data Analytics Course! https://www.analystbuilder.com/courses/excel-for-data-analytics Excel is one of the ...
817,844 views
Did you know you can use the pandas Python library inside Microsoft Excel to conduct advanced statistical modeling? Watch here ...
51,196 views
2 years ago
... IBM Data Analysis Specialization - https://coursera.pxf.io/AoYOdR Tableau Data Visualization - https://coursera.pxf.io/MXYqaN ...
16,017 views
4 weeks ago
Take my Full Excel Course Here: https://www.analystbuilder.com/courses/excel-for-data-analytics Download Datasets: ...
155,877 views
1 year ago
Excel Waterfall Chart: Beginner's Guide Learn how to create a waterfall chart in Excel with this beginner's guide! Waterfall charts ...
56,293 views
In Excel Excel Column Cells add Charts | Data Visualization - Data with Chart in Excel #shorts Learning #Charts #ColumnChart ...
33 views
3 years ago
Want to make your Excel spreadsheets more dynamic? Learn how to create Progress Bars to track goals, deadlines, or tasks ...
451 views
Chart Template for Plan vs Actual Comparisons: Showcase Simple IBCS-Style Chart Template ...
2,416 views
In Ms excel you can Interactive Dashboard in Ms Excel | Data Visualization in Ms Excel | Create Dashboard in Excel Ease, we ...
127 views
1,269,797 views
In the realm of Excel's powerful features lies a tool that transforms raw data into insightful visual representations - Charts. When it ...
58 views
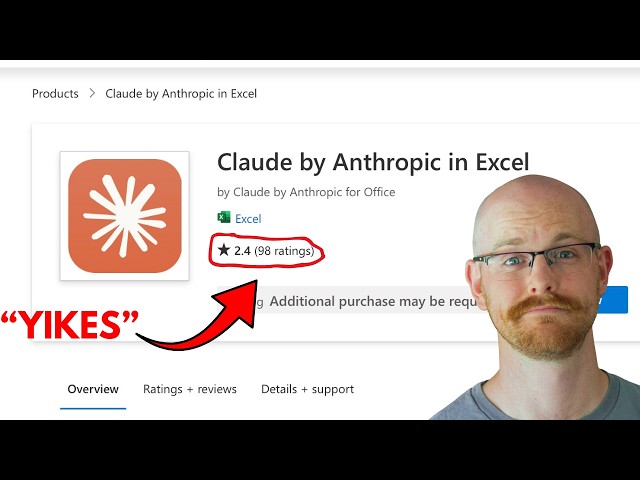
Support Me & More: linktr.ee/benthompsonuk In this video, we will show you why it's time to say goodbye to filters and embrace ...
2,438 views
Power Map in Excel | Data Visualization with Excel Maps | How to Use 3D Map in Excel, you have the opportunity to captivate your ...
218 views
This visualisation shows one of the ways by which data from the Wait Advisor app can be presented: a heatmap as a function of ...
98 views
7 years ago
WELCOME to our real-time Data Visualization boot-camp! Whether you're a student, freelancer, or professional, this Urdu/Hindi ...
3,747 views
Streamed 8 months ago
Check out all my Full Courses on Analyst Builder: https://www.analystbuilder.com/ 25% Off Analyst Builder Code: BOOTCAMP In ...
1,098,727 views
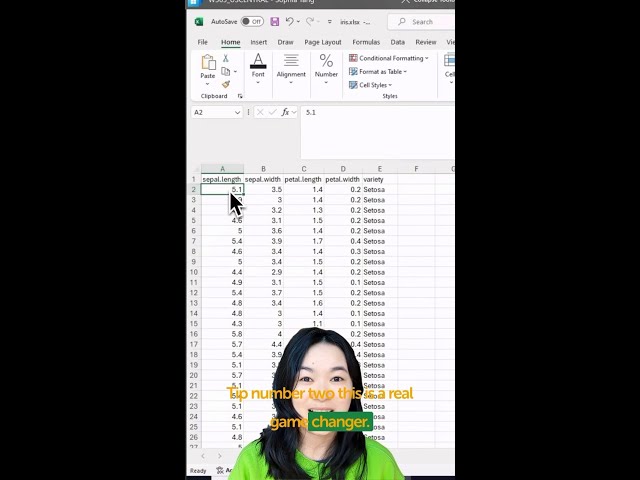
You can now visualize your data using Python in Excel! + = Watch here as Anaconda's Sophia Yang walks through three ...
24,205 views
Learn how to master Excel skills by learning both basic and extended data visualization and business intelligence related ...
126 views
Learn how to create stunning diagrams in Microsoft Excel effortlessly! In this quick tutorial, we'll show you a step-by-step method ...
67 views


![Ultimate Data Analyst Bootcamp [24 Hours!] for FREE | SQL, Excel, Tableau, Power BI, Python, Azure](/api/proxy/image?url=https%3A%2F%2Fi.ytimg.com%2Fvi%2FwQQR60KtnFY%2Fsddefault.jpg)