Upload date
All time
Last hour
Today
This week
This month
This year
Type
All
Video
Channel
Playlist
Movie
Duration
Short (< 4 minutes)
Medium (4-20 minutes)
Long (> 20 minutes)
Sort by
Relevance
Rating
View count
Features
HD
Subtitles/CC
Creative Commons
3D
Live
4K
360°
VR180
HDR
1,272,674 results
Data Visualization Monthly Budget Tracker https://shorturl.at/fhlwz.
63,280 views
3 years ago
Learn Data Analysis Essentials in Excel in Just 12 minutes! Take our Data Analyst Program here: ...
178,353 views
1 year ago
AD: Sign up to enroll for a 7-day free trial with Coursera now!
3,150,614 views
... DOWNLOAD Free Excel file for this video: https://view.flodesk.com/pages/63dd44d5781752946ff2af78 In this video we'll build a ...
1,787,970 views
In this step-by-step tutorial, learn how to create dynamic and interactive Excel dashboards. With a dashboard, you can showcase ...
3,632,656 views
4 years ago
... Free Excel file for this video: https://careerprinciples.myflodesk.com/mssfixa655 In this video, I make 3 McKinsey visuals in Excel ...
456,500 views
2 years ago
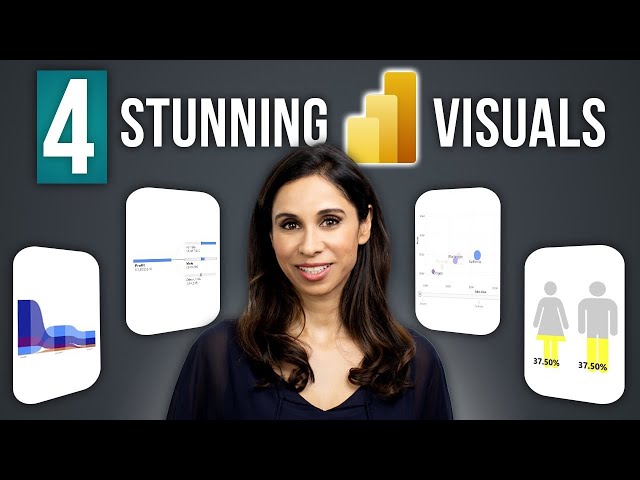
In this video, you'll learn how to visualize data totals, trends, geographical data, and more with Excel's TOP 5 data visualization ...
7,151 views
Build an interactive Excel dashboard for better data visualization in less than 20 minutes. ❗Master Excel with my courses: ...
78,575 views
Sign up for our Excel webinar, times added weekly: https://www.excelcampus.com/blueprint-registration/ PART 1: ...
15,318,764 views
11 years ago
Join our popular FREE Power BI beginners course today https://link.xelplus.com/yt-d-visuals-powerbi-starter Dive into the world ...
556,123 views
Build Dynamic Pie Charts & Filter with Slicers in Excel! (Easy Guide) Unlock hidden insights from your data with interactive pie ...
35,282 views
Nano Banana + Gemini 3: The Data Visualization Workflow You Need | Stop Making Boring Charts – Use This Nano Banana + ...
25,924 views
4 months ago
Save 75% on our AI Literacy for Excel Course during Black Friday/Cyber Monday ...
98,717 views
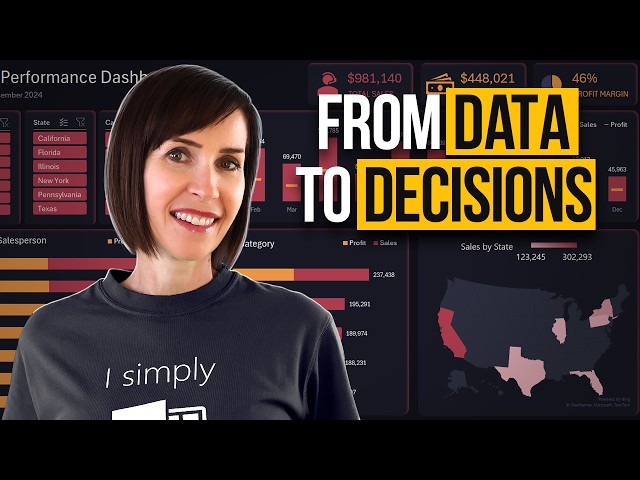
You've just been hired as a Data Analyst for Maven Electronics, a global electronics retailer. It's 4:00pm on a Friday when you ...
561,624 views
Data Visualization using Ms Excel #datavisualization #charts #chartsinexcel #barchart #columnchart #piechart #scatterplot ...
723 views
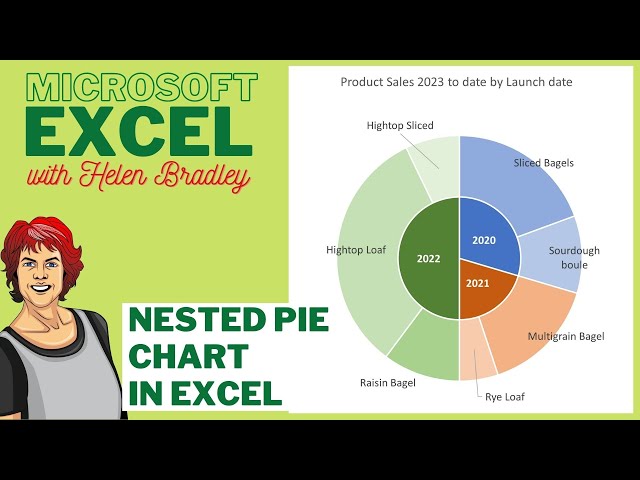
Data Visualization Power Move: Nested Pie Charts in Excel Learn to make a nested pie chart - also called a pie in pie chart in ...
98,843 views
In this tutorial, I'll guide you step-by-step on how to create and use pivot tables, one of Excel's most powerful features for ...
1,318,350 views
MENTORSHIP – Applications for the March 2026 cohort are now open! Apply here → https://theanalyticsaccelerator.com/ We're ...
54,971 views
11 months ago
Create charts that wow your audience. Learn the secrets now—start today! https://link.xelplus.com/yt-g-survey-charts-course ...
296,857 views
6 years ago
We're bringing you the best Excel tips and tricks to help you become a spreadsheet expert! Don't forget to hit that like button to ...
439,900 views
6 months ago