Upload date
All time
Last hour
Today
This week
This month
This year
Type
All
Video
Channel
Playlist
Movie
Duration
Short (< 4 minutes)
Medium (4-20 minutes)
Long (> 20 minutes)
Sort by
Relevance
Rating
View count
Features
HD
Subtitles/CC
Creative Commons
3D
Live
4K
360°
VR180
HDR
1,385 results
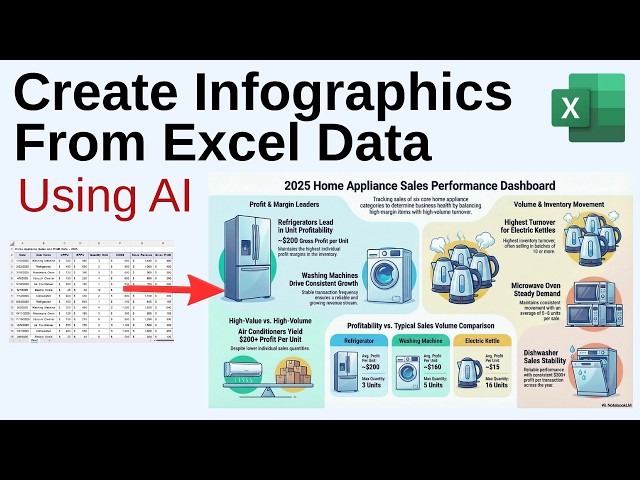
Learn how to create infographics form Excel data. This amazing AI tool turns your data into powerful and insightful infographic ...
140 views
9 days ago
... IBM Data Analysis Specialization - https://coursera.pxf.io/AoYOdR Tableau Data Visualization - https://coursera.pxf.io/MXYqaN ...
16,017 views
4 weeks ago
Stop Learning Excel! Create Dashboards with Copilot Agent (No Skills Needed) Are you still tired of Excel formulas and ...
139 views
How to generate PowerPoint slides from Excel automatically. Get the FREE Claude AI for Work Guide here: ...
31,597 views
2 weeks ago
I tested 30 ways to use Claude for data visualization so you don't have to. Here's what actually works. If you work in finance or ...
7,230 views
3 weeks ago
This module is designed for FP&A professionals, finance students, and analysts who want to transform raw data into clear, ...
201 views
Learn how to create a beautiful Exploded Rose Chart in Microsoft Excel step-by-step. In this tutorial, I will show you how to turn ...
10 views
THIS VIDEO IS ABOUT INTRODUCTION TO DATA VISUALISATION.
13 views
This is how you turn a raw Excel file into a fully interactive, shareable dashboard with one AI prompt. In this video, I test Ajelix's ...
54 views
6 days ago
Stop tracking your finances in boring Excel sheets ❌ In this video, I'll show you how to turn raw data into a powerful and ...
50 views
8 days ago
Namaste doston! Kya aap apne boring Excel tables ko professional dashboards mein badalna chahte hain? In this video, main ...
20 views
5 days ago
Tired of limited Excel charts? Discover how data visualization takes on a whole new dimension with native Python integration ...
553 views
Learn how to create a Dynamic Checkbox Chart in Excel that lets you filter and visualize data instantly. In this step-by-step Excel ...
92 views
1 month ago
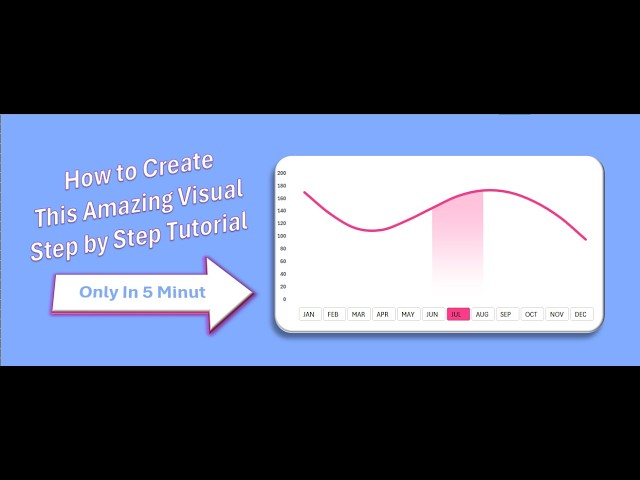
In this video, you'll learn how to create an amazing interactive Excel chart step by step in just 5 minutes. This dynamic chart allows ...
17 views
Master the art of data visualization! In this video, I show you exactly how to build a fully interactive Excel Dashboard from ...
180 views
13 days ago
In this video, you will learn How to Add Data Series to a Chart in Excel (Line Graph or Line Chart). You can add one, two or ...
482 views
In this video, we explore data visualization through an interactive game in Excel. The goal is to help you understand how to ...
3 views
Excel case studies are one of the best ways to build real confidence with formulas, data analysis, and reporting workflows.
838 views
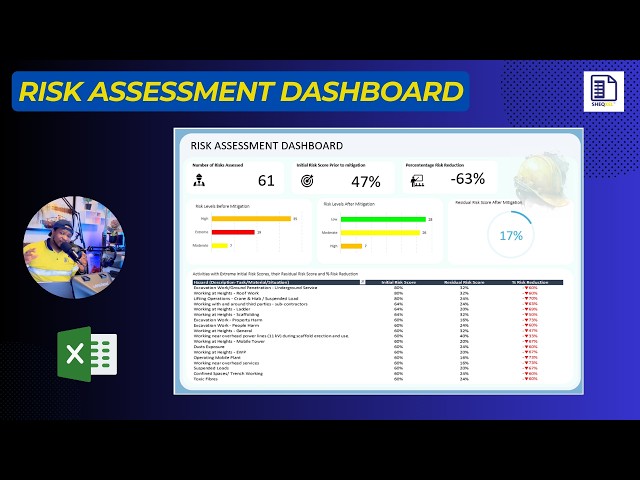
I've just completed a Risk Assessment Dashboard in Microsoft Excel designed to draw meaningful insights from a structured risk ...
185 views
OpenClaw has many helpful use cases, and one of them is automating daily, weekly, or monthly reports. In this video, I have the AI ...
651 views