ViewTube

ViewTube
Sign inSign upSubscriptions
Filters

Upload date

Type

Duration

Sort by

Features

Reset

641 results

Excel Visual
How to Create an Excel CRM Dashboard for Small Business Sales Analysis

The template presented in this video includes all essential data visualizations required for professional sales management ...

2:00:19
How to Create an Excel CRM Dashboard for Small Business Sales Analysis

522 views

4 days ago

Premium Excel
📊 Financial Dashboard Excel | CAPEX & OPEX | Income vs Expense Dashboard | Automated Reporting

... excel, financial reporting excel, excel kpi dashboard, budgeting dashboard excel, excel for finance, data visualization excel, ...

0:58
📊 Financial Dashboard Excel | CAPEX & OPEX | Income vs Expense Dashboard | Automated Reporting

24 views

5 days ago

Kenji Explains
Excel's Game-Changing 5 New Functions!

... Program here: https://www.careerprinciples.com/career-track/the-data-analyst-program DOWNLOAD Free Excel file for this ...

15:26
Excel's Game-Changing 5 New Functions!

41,262 views

4 days ago

Utilizzo professionale di Microsoft Office
EXCEL TRICKS AND SECRETS: 🔗 Share only what you need with SpreadSheetSpace - complete guide

In this video tutorial, we'll explore an Excel add-in that many of you have noticed in my ribbon: SpreadSheetSpace. This is an ...

38:43
EXCEL TRICKS AND SECRETS: 🔗 Share only what you need with SpreadSheetSpace - complete guide

244 views

3 hours ago

SharePoint Wizard
Edit with Copilot in Excel: Working Smarter with Charts & Data

In this video, I show how Edit with Copilot in Excel can dramatically speed up the way we build, format, and manage charts and ...

2:49
Edit with Copilot in Excel: Working Smarter with Charts & Data

80 views

7 days ago

Ajelix
I Turned a Raw Excel File Into an Interactive Dashboard With One AI Prompt

This is how you turn a raw Excel file into a fully interactive, shareable dashboard with one AI prompt. In this video, I test Ajelix's ...

5:26
I Turned a Raw Excel File Into an Interactive Dashboard With One AI Prompt

200 views

6 days ago

Mohammed Esmail
The fastest "From Raw to Viz" you've ever seen

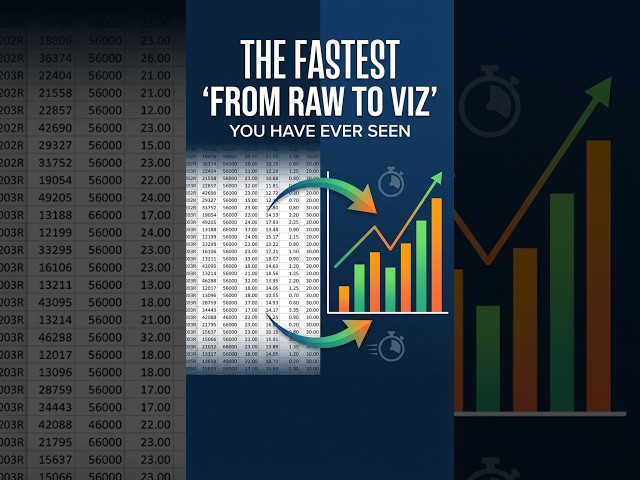
From raw data to a chart — in seconds ⚡ Not a trick. It's Experience. Just how Excel is actually used. Once you understand the ...

0:55
The fastest "From Raw to Viz" you've ever seen

33 views

5 days ago

DataMites
Introduction to SmartArt in Excel for Clear Data Visualization

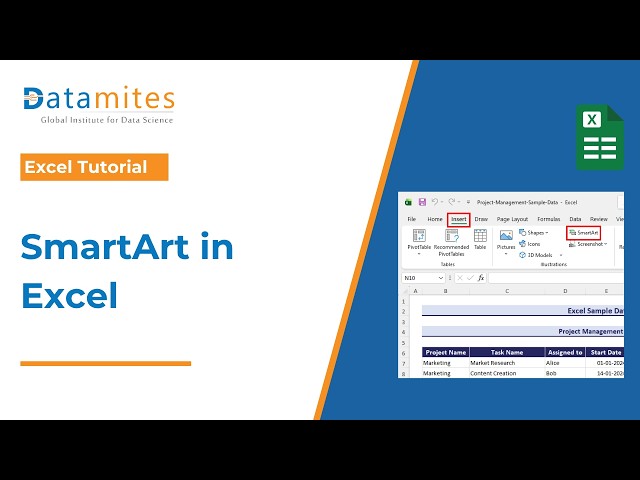
Discover how to use SmartArt in Microsoft Excel to present information in a clear and visually engaging way. This introduction ...

1:54
Introduction to SmartArt in Excel for Clear Data Visualization

60 views

4 days ago

Discover Talent™
Interactive Excel Dashboard with Slicers | HR Analytics Project

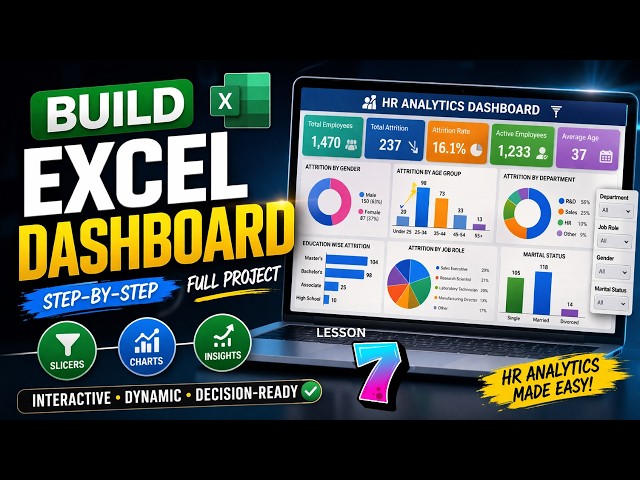
... Excel slicers tutorial, Excel dashboard project, HR analytics Excel, Excel dashboard with filters, Excel data visualization, Excel ...

14:17
Interactive Excel Dashboard with Slicers | HR Analytics Project

289 views

6 days ago

Data is Like
Charts & Graphs in Excel | Data Visualization Tutorial for Beginners 📊🔥#dataanalytics #exceltips

Namaste doston! Kya aap apne boring Excel tables ko professional dashboards mein badalna chahte hain? In this video, main ...

6:18
Charts & Graphs in Excel | Data Visualization Tutorial for Beginners 📊🔥#dataanalytics #exceltips

20 views

5 days ago

Nte Daniel Daniel – Talk Data With Danny
Build a Social Media Analytics Excel Dashboard Tutorial | KPIs, Slicers & Dynamic Insights

Build a complete Social Media Analytics Dashboard in Excel from a completely blank sheet — two ...

2:42:43
Build a Social Media Analytics Excel Dashboard Tutorial | KPIs, Slicers & Dynamic Insights

272 views

4 days ago

Bhardwaj Training Institute
Excel Map Feature Explained | Advance Map Feature | Data Visualization Made Easy

In this video, you will learn the Advance Map Feature in MS Excel in the simplest and most practical way. If you are confused ...

3:59
Excel Map Feature Explained | Advance Map Feature | Data Visualization Made Easy

15 views

5 days ago

YouExcel Training Official
Advanced MS Excel BI & Data Visualization | Master Real-World Business Insights

Unlock the power of Microsoft Excel for business intelligence and data visualization. Transform raw data into actionable insights ...

0:31
Advanced MS Excel BI & Data Visualization | Master Real-World Business Insights

3 views

2 hours ago

Practice for skill
Quick Analysis in Excel | Beginner to Pro in Minutes

What you'll learn: Quick Analysis tool in Excel Fast data visualization Basic Excel formulas Tips for beginners Subscribe for ...

1:00
Quick Analysis in Excel | Beginner to Pro in Minutes

10 views

6 days ago

Mr.Wonderful-AS
Build a powerful Excel dashboard 🚀Improve productivity with this dashboard

Want to analyze production working hours like a pro? In this video, learn how to create a Production Working Hours Analysis ...

23:21
Build a powerful Excel dashboard 🚀Improve productivity with this dashboard

11 views

6 days ago

Principles of Macroeconomics
Chp3 Data Visualization - Excel Practices

Data bars are a quick visualization. Data bars are a fantastic quick visualization tool that live right inside your spreadsheet cells ...

28:36
Chp3 Data Visualization - Excel Practices

1 view

1 day ago

Excel Booster
Excel Recap March 2026 Part-1 📊🔥 #excel #shorts #exceltips #exceltricks

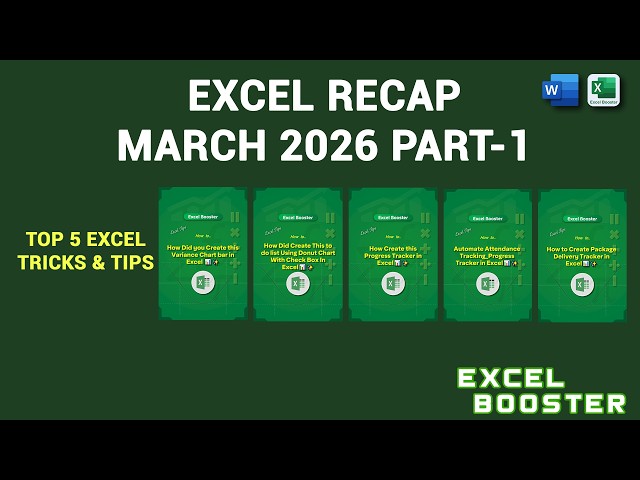
In this video, you'll get a complete recap of all our powerful Excel tutorials from last month — all in one place! Whether you're a ...

4:39
Excel Recap March 2026 Part-1 📊🔥 #excel #shorts #exceltips #exceltricks

36 views

7 days ago

AI Study Hub
Data Visualization Made Easy (Beginner to Pro in Minutes!)

Want to turn boring data into powerful visual stories? In this video, you'll learn the fundamentals of data visualization, including ...

25:56
Data Visualization Made Easy (Beginner to Pro in Minutes!)

7 views

6 days ago

KnowHow
Excel FILTER Function Tutorial | Extract Data Instantly (Real-World Example)

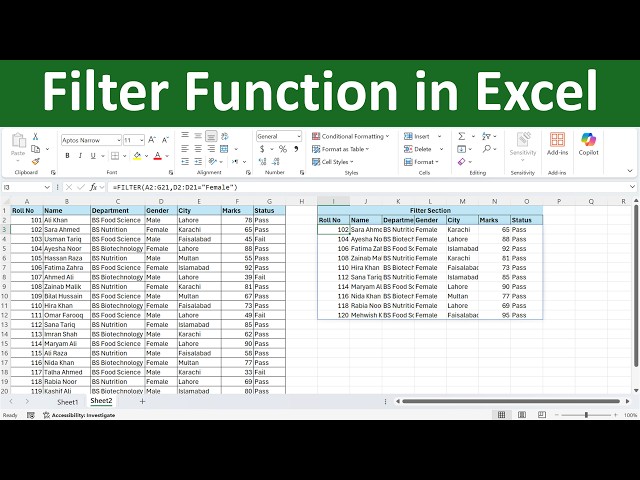
Learn how to use the powerful FILTER function in Excel to extract data instantly from large datasets. In this step-by-step tutorial, ...

3:27
Excel FILTER Function Tutorial | Extract Data Instantly (Real-World Example)

165 views

7 days ago

CSLearn
Excel Data Analysis with Pivot Tables & Dashboards (Step-by-Step) | CSLearn

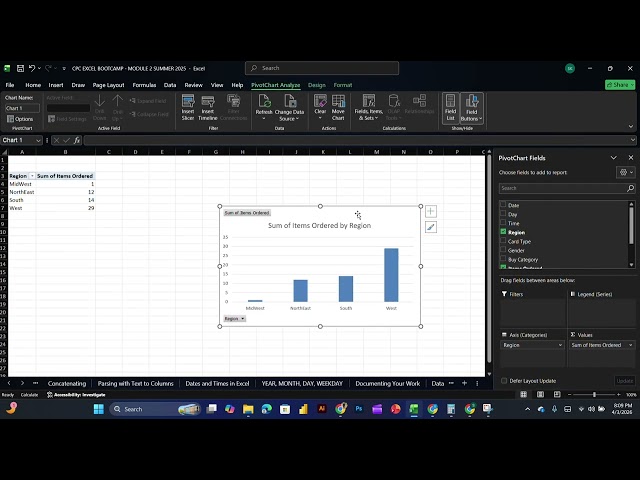
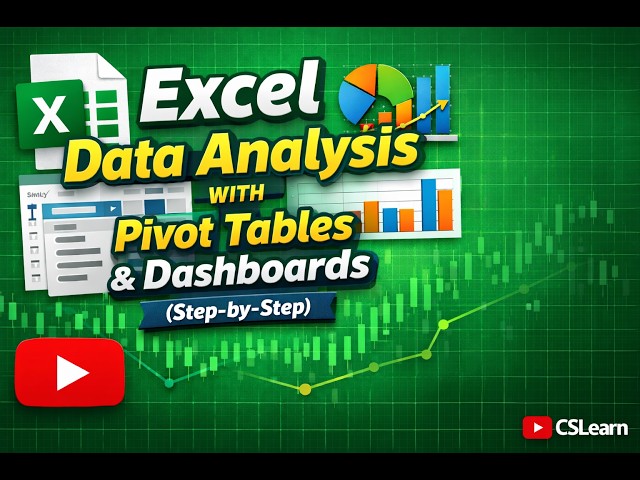
Excel Data Analysis with Pivot Tables & Dashboards (Step-by-Step) | CSLearn Computer Science Learn Learn how to perform ...

20:11
Excel Data Analysis with Pivot Tables & Dashboards (Step-by-Step) | CSLearn

1 view

4 days ago