ViewTube

ViewTube
Sign inSign upSubscriptions
Filters

Upload date

Type

Duration

Sort by

Features

Reset

2,968 results

Lvl 99 TechSkillz
How To Build an Excel Dashboard Using AI in 3 Minutes | Claude in Excel

Building an Excel dashboard used to take hours. In this video, I show you how to build a complete dashboard in Excel using ...

3:38
How To Build an Excel Dashboard Using AI in 3 Minutes | Claude in Excel

1,799 views

2 weeks ago

Spreadsheet Power
Create Infographics form Excel Data | Data Visualization and Analysis Made Easy!!

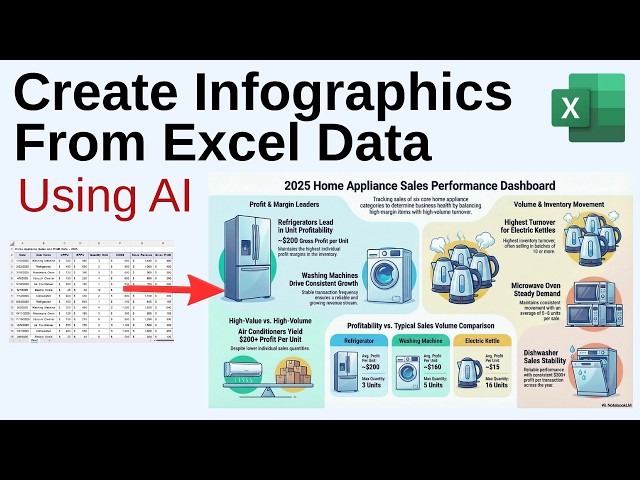
Learn how to create infographics form Excel data. This amazing AI tool turns your data into powerful and insightful infographic ...

4:42
Create Infographics form Excel Data | Data Visualization and Analysis Made Easy!!

140 views

9 days ago

Alex The Analyst
Claude in Excel - Better than Copilot?

... IBM Data Analysis Specialization - https://coursera.pxf.io/AoYOdR Tableau Data Visualization - https://coursera.pxf.io/MXYqaN ...

16:55
Claude in Excel - Better than Copilot?

15,992 views

4 weeks ago

Excel Visual
How to Create an Excel CRM Dashboard for Small Business Sales Analysis

The template presented in this video includes all essential data visualizations required for professional sales management ...

2:00:19
How to Create an Excel CRM Dashboard for Small Business Sales Analysis

511 views

4 days ago

Office Blog
Excel Seekhna Band Karo! 🛑 Create Dashboards with Copilot Agent (No Skills Needed)

Stop Learning Excel! Create Dashboards with Copilot Agent (No Skills Needed) Are you still tired of Excel formulas and ...

5:04
Excel Seekhna Band Karo! 🛑 Create Dashboards with Copilot Agent (No Skills Needed)

138 views

9 days ago

Jovian
Microsoft Excel for Beginners - Data Analysis and Visualization Full Tutorial (No Ads)

Master Microsoft Excel from absolute zero! This is your full beginner tutorial to master spreadsheets. Forget the overwhelm, we'll ...

2:29:46
Microsoft Excel for Beginners - Data Analysis and Visualization Full Tutorial (No Ads)

452 views

4 weeks ago

Excel Visual
How to Create Advanced Excel Payroll Dashboard with a Clean Business Style Design

Step-by-Step Guide to Creating a Professional Excel Payroll Dashboard Template: ...

1:39:05
How to Create Advanced Excel Payroll Dashboard with a Clean Business Style Design

526 views

11 days ago

Career247 and 3 more
Advanced Excel for Data Analytics | Excel Tutorial For Beginners | Excel Training Full Course 2026

Start your journey in Data Analytics with Excel today: https://bit.ly/VExcelAnkita Advanced Excel for Data Analytics | Excel Tutorial ...

2:23:12
Advanced Excel for Data Analytics | Excel Tutorial For Beginners | Excel Training Full Course 2026

49,694 views

Streamed 2 weeks ago

Pavan Lalwani
Create a Powerful Excel Dashboard in 10 Minutes using Copilot AI (No Formula, No Pivot Table)

In this video, learn how to create a fully interactive Excel dashboard in just 10 minutes using Copilot AI. Data Set (Materials): ...

3:40
Create a Powerful Excel Dashboard in 10 Minutes using Copilot AI (No Formula, No Pivot Table)

14,225 views

3 weeks ago

FP&A with CA Asif Masani
Claude + Excel for Finance | Episode 5 Data Visualization

This module is designed for FP&A professionals, finance students, and analysts who want to transform raw data into clear, ...

11:25
Claude + Excel for Finance | Episode 5 Data Visualization

201 views

2 weeks ago

Misan
DATA VISUALISATION WITH MICROSOFT EXCEL

THIS VIDEO IS ABOUT INTRODUCTION TO DATA VISUALISATION.

4:58
DATA VISUALISATION WITH MICROSOFT EXCEL

13 views

2 weeks ago

Christian Martinez: AI for Finance
30 Ways to use Claude for Data Visualization in FP&A and Finance

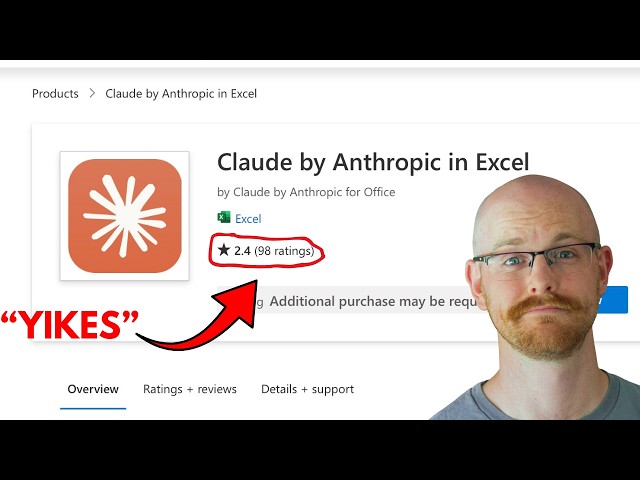
I tested 30 ways to use Claude for data visualization so you don't have to. Here's what actually works. If you work in finance or ...

12:39
30 Ways to use Claude for Data Visualization in FP&A and Finance

7,222 views

3 weeks ago

Discover Talent™
10 Excel Tricks Every Data Analyst Must Know

Top 10 Excel Tricks Every Data Analyst Must Know (Full Masterclass) Stop just "using" Excel and start analyzing like a pro!

1:02:04
10 Excel Tricks Every Data Analyst Must Know

87 views

2 weeks ago

Data is Like
Charts & Graphs in Excel | Data Visualization Tutorial for Beginners 📊🔥#dataanalytics #exceltips

Namaste doston! Kya aap apne boring Excel tables ko professional dashboards mein badalna chahte hain? In this video, main ...

6:18
Charts & Graphs in Excel | Data Visualization Tutorial for Beginners 📊🔥#dataanalytics #exceltips

20 views

5 days ago

EXCEL FOR FINANCE AND BUSINESS NICHOLAS.
Advanced Excel Data Visualization: How To Create Tables+Pivot tables+Pivot charts+Slicers

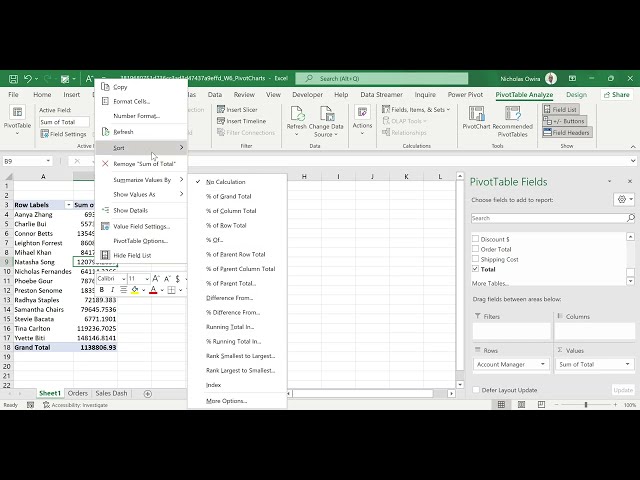
Adanced data analysis/visualization with excel. #excel #exceltips #pivot_table.

1:00:01
Advanced Excel Data Visualization: How To Create Tables+Pivot tables+Pivot charts+Slicers

38 views

2 weeks ago

Principles of Macroeconomics
Chp3 Data Visualization - Excel Practices

Data bars are a quick visualization. Data bars are a fantastic quick visualization tool that live right inside your spreadsheet cells ...

28:36
Chp3 Data Visualization - Excel Practices

1 view

21 hours ago

DataMites
Introduction to SmartArt in Excel for Clear Data Visualization

Discover how to use SmartArt in Microsoft Excel to present information in a clear and visually engaging way. This introduction ...

1:54
Introduction to SmartArt in Excel for Clear Data Visualization

60 views

4 days ago

Earnova
Excel Dashboard in 5 minutes (Step by step)

Learn how to create an Excel dashboard in 5 minutes with this step-by-step tutorial for beginners. In this video, I'll show you how ...

3:25
Excel Dashboard in 5 minutes (Step by step)

23 views

8 days ago

Excel Tricks Tips
Create Exploded Rose Chart in Excel | Step-by-Step Excel Chart Tutorial || #exceltips

Learn how to create a beautiful Exploded Rose Chart in Microsoft Excel step-by-step. In this tutorial, I will show you how to turn ...

7:49
Create Exploded Rose Chart in Excel | Step-by-Step Excel Chart Tutorial || #exceltips

10 views

4 weeks ago

Discover Talent™
Excel Dashboard | Step-by-Step (Raw Data to Interactive Dashboard)

Excel Dashboard Full Project | Step-by-Step (Raw Data to Interactive Dashboard) Welcome to Discover Talent! In this video, we ...

36:39
Excel Dashboard | Step-by-Step (Raw Data to Interactive Dashboard)

152 views

3 weeks ago