ViewTube

ViewTube
Sign inSign upSubscriptions
Filters

Upload date

Type

Duration

Sort by

Features

Reset

34,402 results

Chandoo
The Ultimate Excel Dashboard: Visualize Data Like a Pro

OFF My Dashboards Course (code: SAVE50) https://chandoo.org/wp/excel-school-program/ ~ Become an Excel Dashboard ...

29:50
The Ultimate Excel Dashboard: Visualize Data Like a Pro

115,778 views

5 months ago

Gurru Tech Solutions
Nano Banana + Gemini 3: AI Data Visualization That Actually Works

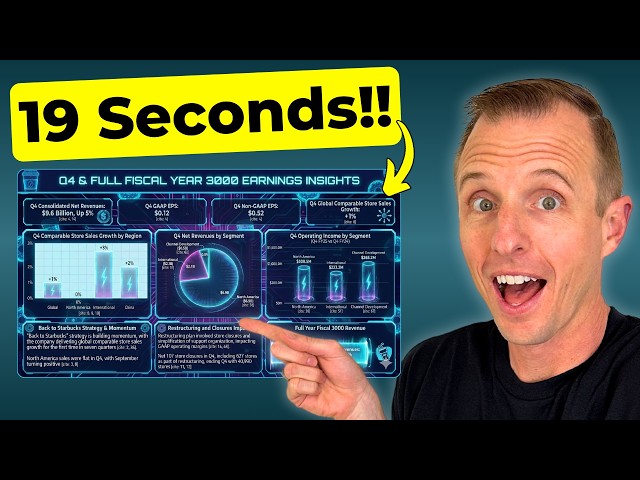
Nano Banana + Gemini 3: The Data Visualization Workflow You Need | Stop Making Boring Charts – Use This Nano Banana + ...

10:14
Nano Banana + Gemini 3: AI Data Visualization That Actually Works

25,932 views

4 months ago

Simon Sez IT
How to Create Data Visualization in Excel using Tables, Slicers and Charts (Includes Free Files)

Download the free course files and follow along here: ...

46:13
How to Create Data Visualization in Excel using Tables, Slicers and Charts (Includes Free Files)

3,074 views

4 months ago

Excel Campus - Jon
Google's New AI Creates Dashboards at INSANE Speeds

Save 75% on our AI Literacy for Excel Course during Black Friday/Cyber Monday ...

9:22
Google's New AI Creates Dashboards at INSANE Speeds

98,737 views

4 months ago

Excel Visual
How to Make a Personal Finance Dashboard in Excel for Expense Management

Managing your personal finances becomes much easier when you can clearly see where your money goes each month.

1:40:09
How to Make a Personal Finance Dashboard in Excel for Expense Management

54,121 views

5 months ago

Ms Excel
Create Professional Excel Dashboard in just 10 Minutes || Interactive & Dynamic #excel #dashboard

We're bringing you the best Excel tips and tricks to help you become a spreadsheet expert! Don't forget to hit that like button to ...

13:40
Create Professional Excel Dashboard in just 10 Minutes || Interactive & Dynamic #excel #dashboard

440,163 views

6 months ago

Kenji Explains
NEW Claude in Excel: How Good Is It?

Testing how well Claude for Excel performs in data cleaning, financial modeling, and more! Take our Complete Finance ...

15:00
NEW Claude in Excel: How Good Is It?

172,276 views

2 months ago

Satish Dhawale
How to Create Dynamic Target vs Actual Chart in Excel | Excel Data Visualization Tutorial

How to Create Dynamic Target vs Actual Chart in Excel | Excel Data Visualization Tutorial #SD79 Satish Dhawale Sir has ...

36:16
How to Create Dynamic Target vs Actual Chart in Excel | Excel Data Visualization Tutorial

15,784 views

8 months ago

Excel Bee
Interactive dashboard in excel | Excel data visualization dashboard

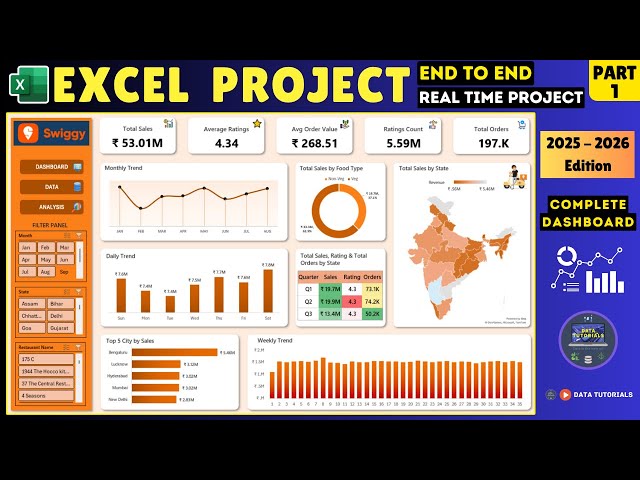
Download Dataset and Icons Set: https://www.theexcelbee.com/p/download-sales-dataset-with-icons.html Excel/Power BI ...

58:46
Interactive dashboard in excel | Excel data visualization dashboard

721 views

4 months ago

Manus AI
Introducing Data Visualization for Manus

Introducing Data Visualization for Manus! Say goodbye to spreadsheet chaos. Whether you're analyzing competitors, prepping for ...

0:42
Introducing Data Visualization for Manus

18,620 views

8 months ago

Spreadsheet Power
Create Infographics form Excel Data | Data Visualization and Analysis Made Easy!!

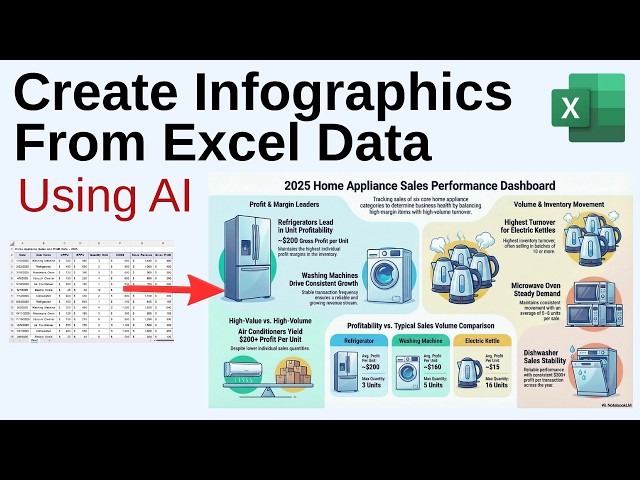
Learn how to create infographics form Excel data. This amazing AI tool turns your data into powerful and insightful infographic ...

4:42
Create Infographics form Excel Data | Data Visualization and Analysis Made Easy!!

140 views

9 days ago

Reza Dorrani
How to Turn Excel Spreadsheets into Power Apps (2025) | Step-by-Step Beginners Tutorial

In this 2025 Power Apps tutorial, learn how to transform your Excel spreadsheets into fully functional Power Apps — from setup to ...

22:46
How to Turn Excel Spreadsheets into Power Apps (2025) | Step-by-Step Beginners Tutorial

178,578 views

5 months ago

Accounts Expert
Excel Mastery in 90 Minutes | Complete Excel Course in One Video

Learn Microsoft Excel from basics to advanced in just 1 hour 32 minutes. This complete Excel course covers formulas, functions, ...

1:32:23
Excel Mastery in 90 Minutes | Complete Excel Course in One Video

172,968 views

6 months ago

The Wular Academy
PYTHON IN EXCEL: Data Analysis & Visualization with Pandas & Seaborn.

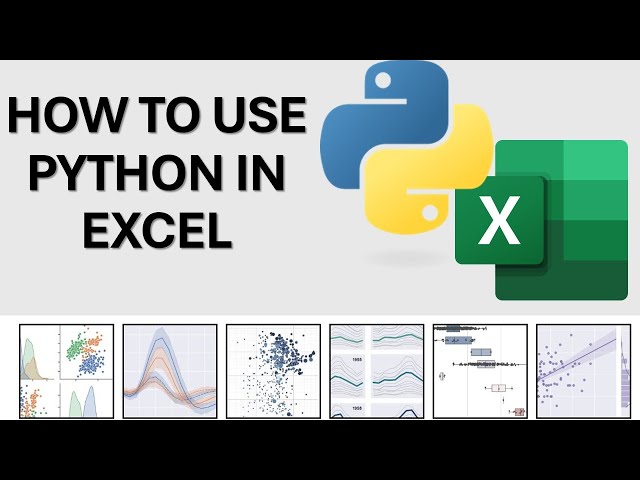
See how Python is transforming Excel into a data powerhouse. In this video, we'll demonstrate: • The groundbreaking PY function ...

22:00
PYTHON IN EXCEL: Data Analysis & Visualization with Pandas & Seaborn.

6,879 views

10 months ago

Excel Dictionary
Never Before Seen Excel Data Visualization Trick

This amazing Excel trick will blow your mind! In this video, I'll show you how to create stunning bar charts using nothing but the ...

1:45
Never Before Seen Excel Data Visualization Trick

3,731 views

7 months ago

Moe Lueker
How to turn an Excel Into a Live Dashboard Website (ChatGPT + Replit Easy Workflow)

This is perfect if you want Excel data visualization that actually looks good on mobile, is easy to understand, and is simple to share ...

20:46
How to turn an Excel Into a Live Dashboard Website (ChatGPT + Replit Easy Workflow)

6,220 views

3 months ago

Dr. Asif’s Mol. Biology
Best Free Data Visualization Tool for Publication-Ready Graphs | RawGraphs.io Tutorial

Welcome to this video on RawGraphs.io, an open-source data visualization tool designed for everyone—from beginners to data ...

8:24
Best Free Data Visualization Tool for Publication-Ready Graphs | RawGraphs.io Tutorial

2,020 views

10 months ago

Business School 101
What is Data Visualization? | Business Analytics | From A Business Professor

Have you ever looked at a spreadsheet full of numbers and felt completely overwhelmed? You're not alone. That's why today ...

6:52
What is Data Visualization? | Business Analytics | From A Business Professor

2,740 views

5 months ago

Data Tutorials
Excel Dashboard Project 2025 | Real-World Swiggy Sales Analysis | Beginner to Pro #excel PART 1

excel #powerbi #python Part 2 - https://youtu.be/l7Ogn_5dXAI ⭐For Important Data Analyst Materials and Projects in Power BI, ...

1:20:34
Excel Dashboard Project 2025 | Real-World Swiggy Sales Analysis | Beginner to Pro #excel PART 1

58,235 views

4 months ago

Gray Technical
3D Graphs in Excel Tutorial – Easy Data Visualization

Create stunning 3D graphs directly in Excel using XYZ Mesh! This tutorial shows you step-by-step how to transform simple XYZ ...

4:38
3D Graphs in Excel Tutorial – Easy Data Visualization

2,230 views

9 months ago