Upload date
All time
Last hour
Today
This week
This month
This year
Type
All
Video
Channel
Playlist
Movie
Duration
Short (< 4 minutes)
Medium (4-20 minutes)
Long (> 20 minutes)
Sort by
Relevance
Rating
View count
Features
HD
Subtitles/CC
Creative Commons
3D
Live
4K
360°
VR180
HDR
144,825 results
In this video we take a look at the best resources to learn Data Visualization in 2025! 25% off Analyst Builder Code: ...
16,277 views
10 months ago
WELCOME to our real-time Data Visualization boot-camp! Whether you're a student, freelancer, or professional, this Urdu/Hindi ...
3,748 views
Streamed 8 months ago
Video Description: Master Data Visualization with Python: From Beginner to Advanced! In this comprehensive Data ...
39,452 views
1 year ago
Presented by Alisa Rod. This video is part of a series of lectures recorded to teach about basic data visualization concepts.
346 views
4 years ago
... Data Analysis Specialization - https://coursera.pxf.io/AoYOdR Tableau Data Visualization - https://coursera.pxf.io/MXYqaN ...
222,440 views
3 years ago
Presented by David Christensen. This video is part of a series of lectures recorded to teach about basic data visualization ...
317 views
Take my Full Pandas Course Here: https://www.analystbuilder.com/courses/pandas-for-data-analysis Download Datasets: ...
129,036 views
Hello everyone! In todays video I want to show you how you can use Obsidian for data visualization by using Obsidian Charts, ...
26,633 views
2 years ago
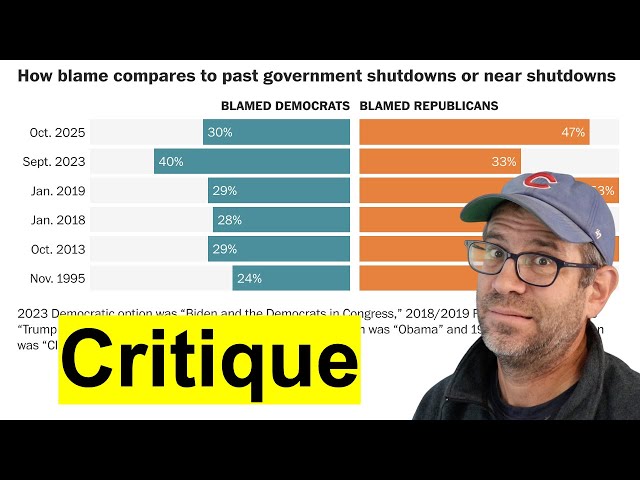
Whenever we see or generate a data visualization it's important that we review what does and doesn't work in the visual. In this ...
1,884 views
"SciBlend: Advanced Data Visualization Workflows" by José Marín at Blender Conference 2025 Scientific data visualization is ...
3,381 views
6 months ago
A short film describing the development of a prototype application for the Oculus Rift DK2 headset, to visualise subsurface ...
8,073 views
11 years ago
Using Ellipse and Shape Builder create Data Visualization Graph in Adobe Illustrator Adobe Illustrator Tutorial Graphic Designer ...
2,637 views
8 months ago
Pat introduces the DAIJ model for giving a critique to a data visualization that is often used to critique art. By describing, analyzing ...
713 views
5 months ago
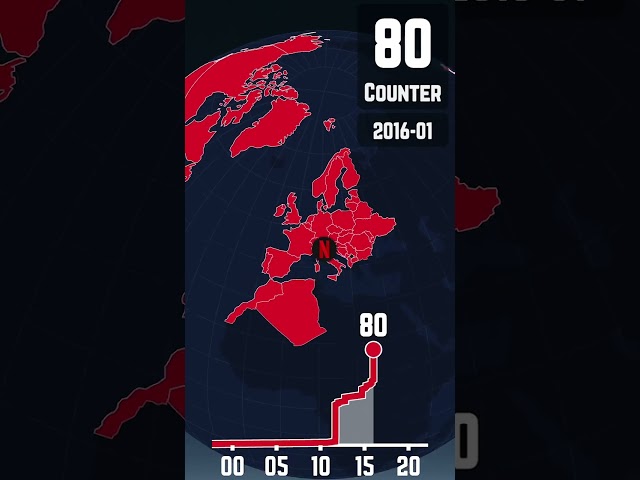
In this video, I visualized the global spread of Netflix from Scotts Valley, California to the entire world. Have an idea for a future ...
126,001 views
Learn how to craft effective data visualizations. Part of https://curran.github.io/dataviz-course-2018/
7,843 views
7 years ago
Check out my Full Tableau Course Here: https://www.analystbuilder.com/courses/tableau-for-data-visualization This is our first of ...
993,704 views
ai #python #codanics #artificialintelligence #urdu This complete course is being uploaded here: ...
6,543 views
Streamed 2 years ago
In this video, we dive deep into the world of data visualization in Python using three powerful libraries: Matplotlib, Seaborn, and ...
158 views
Gabby Palomo leads a discussion of Chapter 4 ("Color scales") and Chapter 5 ("Directory of visualizations") from Fundamentals of ...
186 views
2020-03-31 lecture from Advanced Data Analysis course at UW-Madison, https://kbroman.org/AdvData, on data visualization.
154 views
5 years ago