Upload date
All time
Last hour
Today
This week
This month
This year
Type
All
Video
Channel
Playlist
Movie
Duration
Short (< 4 minutes)
Medium (4-20 minutes)
Long (> 20 minutes)
Sort by
Relevance
Rating
View count
Features
HD
Subtitles/CC
Creative Commons
3D
Live
4K
360°
VR180
HDR
39,876 results
Take my Full Excel for Data Analytics Course! https://www.analystbuilder.com/courses/excel-for-data-analytics In this video we ...
1,220,694 views
4 years ago
Excel is one of the most used skills in the data world. In this series we will be walking through all of the most important topics that ...
225,568 views
Take my Full Excel for Data Analytics Course! https://www.analystbuilder.com/courses/excel-for-data-analytics Excel is one of the ...
817,772 views
Did you know you can use the pandas Python library inside Microsoft Excel to conduct advanced statistical modeling? Watch here ...
51,173 views
2 years ago
... IBM Data Analysis Specialization - https://coursera.pxf.io/AoYOdR Tableau Data Visualization - https://coursera.pxf.io/MXYqaN ...
16,017 views
4 weeks ago
Excel Waterfall Chart: Beginner's Guide Learn how to create a waterfall chart in Excel with this beginner's guide! Waterfall charts ...
56,249 views
1 year ago
Chart Template for Plan vs Actual Comparisons: Showcase Simple IBCS-Style Chart Template ...
2,413 views
Take my Full Excel Course Here: https://www.analystbuilder.com/courses/excel-for-data-analytics Download Datasets: ...
155,820 views
17,843 views
1,269,583 views
Want to make your Excel spreadsheets more dynamic? Learn how to create Progress Bars to track goals, deadlines, or tasks ...
451 views
In Excel Excel Column Cells add Charts | Data Visualization - Data with Chart in Excel #shorts Learning #Charts #ColumnChart ...
33 views
3 years ago
In Ms excel you can Interactive Dashboard in Ms Excel | Data Visualization in Ms Excel | Create Dashboard in Excel Ease, we ...
127 views
Learn the top ways to make money online in your free time in 2024! Discover how you can start freelancing on platforms like ...
9,182 views
Support Me & More: linktr.ee/benthompsonuk In this video, we will show you why it's time to say goodbye to filters and embrace ...
2,438 views
629,672 views
In the realm of Excel's powerful features lies a tool that transforms raw data into insightful visual representations - Charts. When it ...
58 views
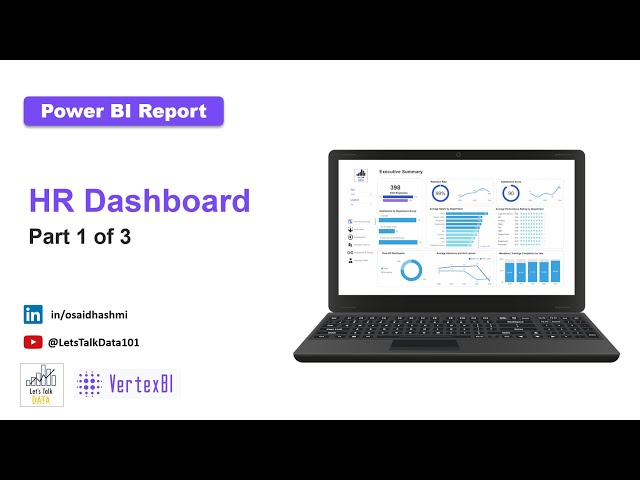
A step-by-step tutorial to build HR Dashboard for higher-level management, e.g. HR Head or HR Director. It's a useful analytical ...
1,954 views
WELCOME to our real-time Data Visualization boot-camp! Whether you're a student, freelancer, or professional, this Urdu/Hindi ...
3,747 views
Streamed 8 months ago
excel #exceltutorial #datascience ✓ This video is part of the 40 days course PythonKaChilla version 2.0. Python ka chilla v2.0 ...
68,348 views