ViewTube

ViewTube
Sign inSign upSubscriptions
Filters

Upload date

Type

Duration

Sort by

Features

Reset

3,593,208 results

freeCodeCamp.org
Excel Data Visualization Course – Guide to Charts & Dashboards

This comprehensive tutorial will teach you everything you need to know about Excel chart types, chart customization, and creating ...

1:10:23
Excel Data Visualization Course – Guide to Charts & Dashboards

113,741 views

1 year ago

Upskill
7 Data Visualization Tricks on Excel - Tutorial

Data Visualization Monthly Budget Tracker https://shorturl.at/fhlwz.

4:48
7 Data Visualization Tricks on Excel - Tutorial

63,282 views

3 years ago

Chandoo
The Ultimate Excel Dashboard: Visualize Data Like a Pro

OFF My Dashboards Course (code: SAVE50) https://chandoo.org/wp/excel-school-program/ ~ Become an Excel Dashboard ...

29:50
The Ultimate Excel Dashboard: Visualize Data Like a Pro

116,186 views

5 months ago

Kenji Explains
Learn 80% of Data Analysis in Excel in Just 12 Minutes

Learn Data Analysis Essentials in Excel in Just 12 minutes! Take our Data Analyst Program here: ...

12:09
Learn 80% of Data Analysis in Excel in Just 12 Minutes

178,602 views

1 year ago

ExcelTricks14
Data visualization in excel | 2 Easy data visualization tools |

Data visualization in excel | 2 Easy data visualization tools |

0:08
Data visualization in excel | 2 Easy data visualization tools |

108,423 views

3 years ago

EliteBps
🌍 Create a Powerful Sales Excel Dashboard

Take your sales reporting to the next level with this comprehensive guide on building a dynamic Sales Excel Dashboard tailored ...

0:18
🌍 Create a Powerful Sales Excel Dashboard

335,798 views

1 year ago

CheatSheets
Python in Excel‼️ #excel #python

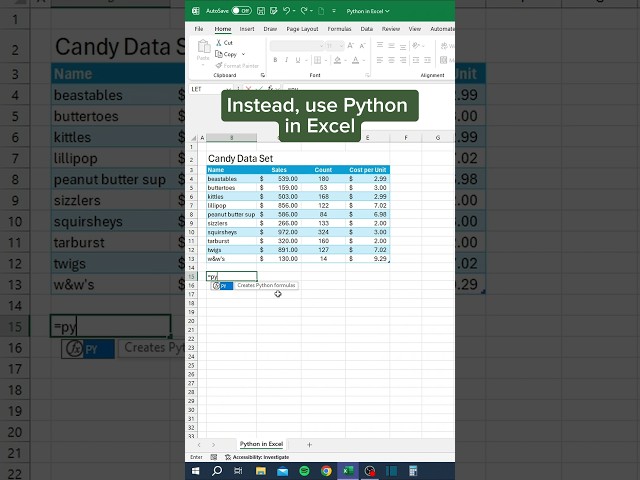
In this video we show a basic function of Python in Excel. ‍ Don't forget to register for a FREE Excel Class at the link below!

0:29
Python in Excel‼️ #excel #python

694,514 views

2 years ago

Kenji Explains
Make Impressive McKinsey Visuals in Excel!

... Free Excel file for this video: https://careerprinciples.myflodesk.com/mssfixa655 In this video, I make 3 McKinsey visuals in Excel ...

16:47
Make Impressive McKinsey Visuals in Excel!

456,604 views

2 years ago

Kenji Explains
Master Data Analysis on Excel in Just 10 Minutes

AD: Sign up to enroll for a 7-day free trial with Coursera now!

11:32
Master Data Analysis on Excel in Just 10 Minutes

3,151,438 views

3 years ago

Kevin Stratvert
Excel Charts and Graphs Tutorial

Learn Excel in just 2 hours: https://kevinstratvert.thinkific.com In this step-by-step tutorial, learn how to pull together charts in Excel.

24:31
Excel Charts and Graphs Tutorial

1,317,274 views

2 years ago

Luke Barousse
How I use Excel as a Data Analyst 📊🤓

Follow me on LinkedIn https://www.linkedin.com/in/luke-b/ OR on X/Twitter https://twitter.com/LukeBarousse Subscribe to ...

0:38
How I use Excel as a Data Analyst 📊🤓

281,444 views

3 years ago

Kenji Explains
Make an Awesome Excel Dashboard in Just 15 Minutes

... DOWNLOAD Free Excel file for this video: https://view.flodesk.com/pages/63dd44d5781752946ff2af78 In this video we'll build a ...

15:27
Make an Awesome Excel Dashboard in Just 15 Minutes

1,788,428 views

3 years ago

Simon Sez IT
Interactive Excel Charts and Dashboards - Data Visualization Course

Download the free course files and follow along here: ➡️https://www.simonsezit.com/charts-and-dashboards-in-excel-demo-files ...

2:39:02
Interactive Excel Charts and Dashboards - Data Visualization Course

13,127 views

1 year ago

Byte Tech
Create Instant Dashboard In Excel 🔥 | This Excel Trick Will Blow Your Mind ‼️ #exceltips #bytetech

Create Instant Dashboard In Excel 🔥 | This Excel Trick Will Blow Your Mind ‼️ #exceltips #bytetech Please Follow Me Here ...

0:46
Create Instant Dashboard In Excel 🔥 | This Excel Trick Will Blow Your Mind ‼️ #exceltips #bytetech

408,821 views

2 years ago

Excel Dictionary
TOP 5 Excel Data Visualization Tips (Become a Data Visualization PRO)

In this video, you'll learn how to visualize data totals, trends, geographical data, and more with Excel's TOP 5 data visualization ...

6:49
TOP 5 Excel Data Visualization Tips (Become a Data Visualization PRO)

7,152 views

2 years ago

Excel Dictionary
How to visualize data with Python in Excel. 🤯 #excel  #python #tutorial

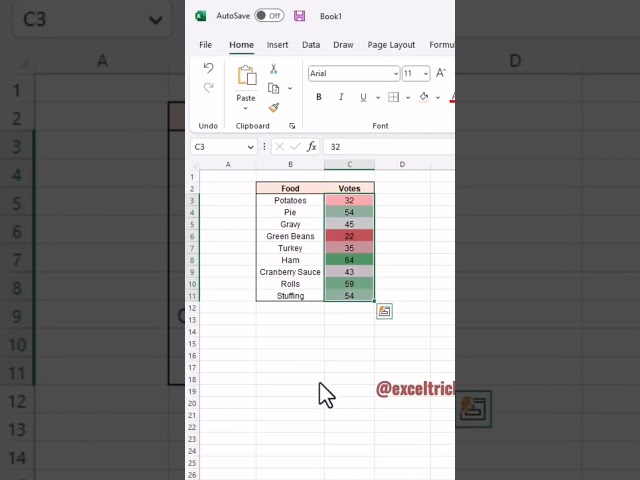
Saw the intern visualizing his data like this so I showed him this tip activate python store your data as a python data.

0:38
How to visualize data with Python in Excel. 🤯 #excel #python #tutorial

91,747 views

1 year ago

Simplilearn
DATA VISUALIZATION In EXCEL | How To Build Interactive CHARTS In EXCEL | Simplilearn #excel #charts

"️ IBM - Data Analyst ...

21:06
DATA VISUALIZATION In EXCEL | How To Build Interactive CHARTS In EXCEL | Simplilearn #excel #charts

14,629 views

2 years ago

AI Make Money Tools
3 AI Tools for Data Visualization Everyone Should Try

3 AI Tools for Data Visualization Everyone Should Try #makemoneywithai Stop wasting hours on tasks that AI can handle in ...

0:20
3 AI Tools for Data Visualization Everyone Should Try

180,381 views

1 year ago

Simon Sez IT
How to Create Data Visualization in Excel using Tables, Slicers and Charts (Includes Free Files)

Download the free course files and follow along here: ...

46:13
How to Create Data Visualization in Excel using Tables, Slicers and Charts (Includes Free Files)

3,074 views

4 months ago

Bright Minds Hub
Auto Highlight Row in Excel 🌟 EASY Tutorial 🔥 || Excel Tips

Unlock the power of Excel with our easy tutorial on how to auto-highlight rows! In this step-by-step guide, we'll show you simple ...

0:56
Auto Highlight Row in Excel 🌟 EASY Tutorial 🔥 || Excel Tips

810,949 views

1 year ago