Upload date
All time
Last hour
Today
This week
This month
This year
Type
All
Video
Channel
Playlist
Movie
Duration
Short (< 4 minutes)
Medium (4-20 minutes)
Long (> 20 minutes)
Sort by
Relevance
Rating
View count
Features
HD
Subtitles/CC
Creative Commons
3D
Live
4K
360°
VR180
HDR
272 results
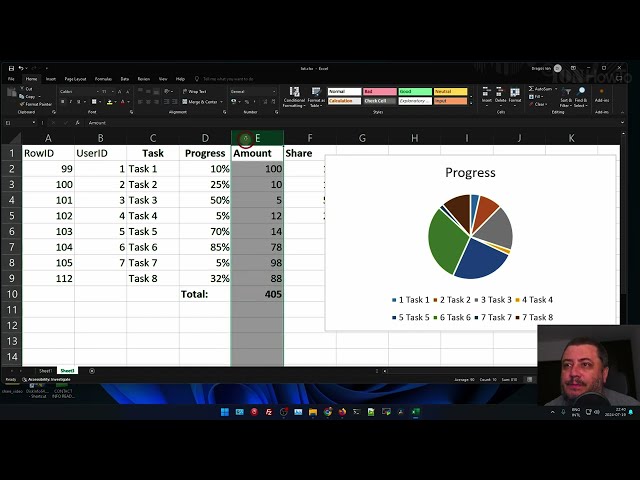
Using Excel to combine two datasets and perform data visualization.
6 views
1 year ago
How to Create a Pie Chart in Excel - Step-by-Step Tutorial for Beginners Welcome to our detailed tutorial on creating pie charts in ...
22 views
UAS Data Visualization Project Data Pemasaran Digital Nama : Soffia Nur Afin Nim : V8424057 Kelas : A Prodi : Pemasaran ...
43 views
3 months ago
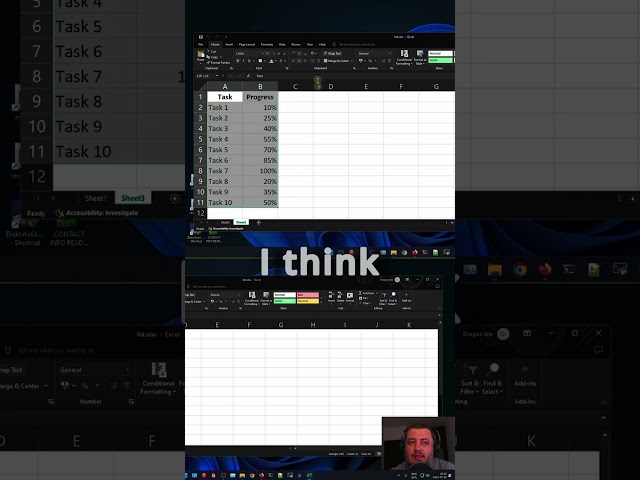
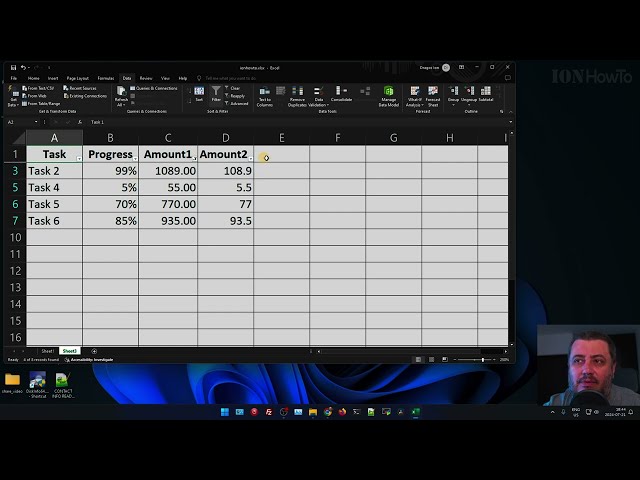
How to Create a Progress Bar in Excel, Step-by-Step Guide In this video, we will walk you through the process of creating a ...
37 views
Download Filmora: https://bit.ly/4dN0Fhi Creator Hub: https://bit.ly/3UcDg1A #Filmora15 #VideoEditingTools ...
6,650 views
4 months ago
Are you an #Excel newbie? If so, learning how to sort your data is crucial to saving time and energy sifting through data. In the ...
7 views
76 views
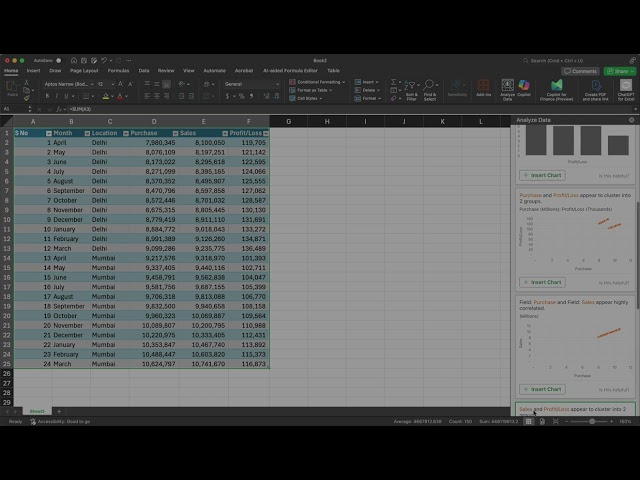
Learn how to analyze sales data in Excel and create powerful insights using charts! In this video, I walk through: ✓ Organizing ...
79 views
7 months ago
Learn how to easily and quickly autofit columns and rows in Excel in seconds. With this autofit tip you can save time and energy by ...
28 views
Microsoft excel tutorial | Excel Begineer's Guide | Excel learning Welcome to @Piyushabharti your go-to destination for ...
42 views
2 years ago
148 views
How to Make Bar Charts in Excel. Excel bar chart and bar graphs tutorial for beginners. Creating a bar chart in Excel is an ...
141 views
Excel How To Filter Data. Data Filtering Techniques in Excel. How to filter data in Excel! I help you become proficient in using ...
38 views
Take a step forward on Excel : https://www.amazon.com/Excel-Formulas-PivotTables-Conditionnal-Formatting/dp/B0CG8F7TF9 ...
24 views
6 months ago
Quickly and easily learn how to freeze and unfreeze columns and rows in Excel using the Freeze Panes function. Learn how to ...
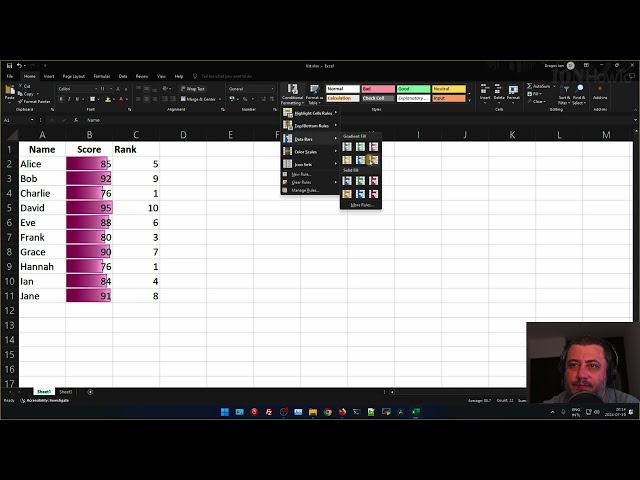
These are my 4 tips to visualise your data that I learned on the the way...
696 views
3 years ago
Welcome to this step-by-step tutorial on How to Create a Gantt Chart in Excel! Whether you're managing a small project or ...
257 views
If you're tired of dealing with duplicate data in Excel, you've come to the right place. In this tutorial, we'll walk you through two ...
10 Ultimate Excel Tips And Tricks Is video mein Hamen Excel ke most important useful tips and tricks ke bare mein baat ki hai ...
81 views
10 views