Upload date
All time
Last hour
Today
This week
This month
This year
Type
All
Video
Channel
Playlist
Movie
Duration
Short (< 4 minutes)
Medium (4-20 minutes)
Long (> 20 minutes)
Sort by
Relevance
Rating
View count
Features
HD
Subtitles/CC
Creative Commons
3D
Live
4K
360°
VR180
HDR
1,991 results
Katie Ledecky may just be the GOAT. We explain why the 1500m race is so brutal and how dominant Katie really is.
1,195 views
1 year ago
This is CS50, Harvard University's introduction to the intellectual enterprises of computer science and the art of programming.
60,420 views
https://www.anapaintsllc.com/physics-research-fellow-auc-data-science-initiative.
10 views
7 months ago
11,192 views
... data analytics project, Power BI tutorial, Power BI beginner project, sales dashboard Power BI, Power BI data visualization, cafe ...
1,031 views
3 months ago
In this video, I have built a complete HR Analytics Dashboard in Power BI to analyze employee attrition and uncover key workforce ...
465 views
2 weeks ago
Watch this dynamic data visualization track the Top 10 most subscribed channels in the world from 2015 all the way to 2025.
44 views
1 month ago
... charts, analytics reporting and it makes my data look SO good. #dataanalytics #datavisualization #dataviz #infographics #graph ...
962 views
Using Excel to combine two datasets and perform data visualization.
6 views
... Python data analysis tutorial Python data analysis projects End-to-end data analysis with Python Python data visualization ...
862 views
2 years ago
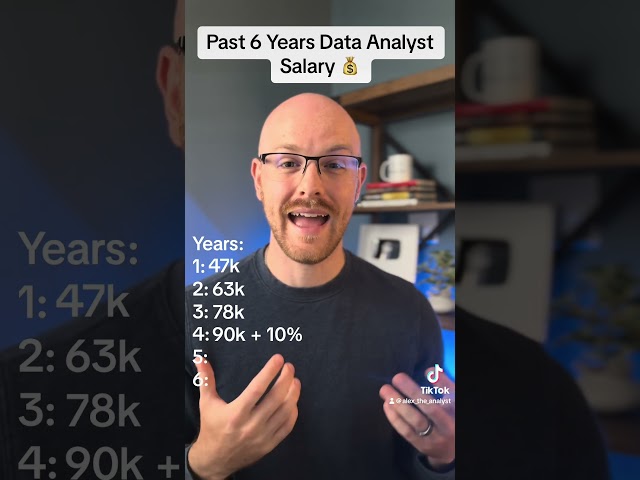
Right so let's go through my salaries over the past six years as a data analyst my very first job as a data analyst was that a ...
57,616 views
The key difference between a data analyst vs a data scientist explained in a few seconds!
378 views
3 years ago
2 views
1 view
8 months ago
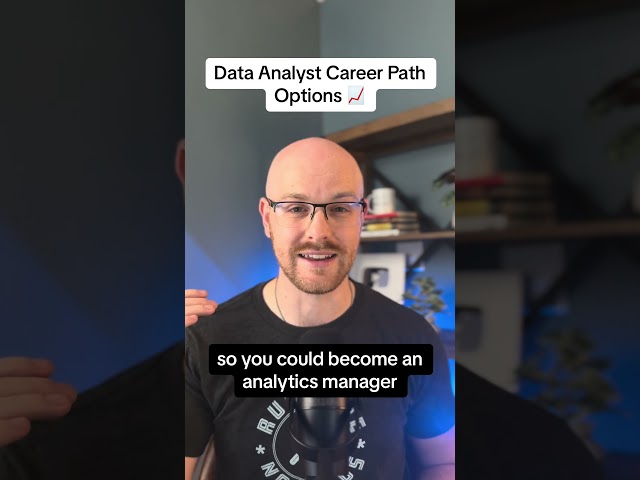
Let's take a look at the career path of a data analyst starting with an entry-level data analyst you just landed your first job what are ...
114,114 views
These are my 4 tips to visualise your data that I learned on the the way...
696 views