ViewTube

ViewTube
Sign inSign upSubscriptions
Filters

Upload date

Type

Duration

Sort by

Features

Reset

1,938 results

CS50
CS50R - Lecture 1 - Representing Data

This is CS50, Harvard University's introduction to the intellectual enterprises of computer science and the art of programming.

1:39:22
CS50R - Lecture 1 - Representing Data

59,993 views

1 year ago

Atish Jain
Python Data Science Project for beginners

... Python data analysis tutorial Python data analysis projects End-to-end data analysis with Python Python data visualization ...

28:39
Python Data Science Project for beginners

860 views

2 years ago

SportsBall
Katie Ledecky Dominance #sportsball #datavisualization #olympics #swimming

Katie Ledecky may just be the GOAT. We explain why the 1500m race is so brutal and how dominant Katie really is.

0:49
Katie Ledecky Dominance #sportsball #datavisualization #olympics #swimming

1,189 views

1 year ago

ana paints
Stepping Into Data: AR/VR Data Visualizations from .csv data with Blender

https://www.anapaintsllc.com/physics-research-fellow-auc-data-science-initiative.

1:00
Stepping Into Data: AR/VR Data Visualizations from .csv data with Blender

10 views

7 months ago

Theo Pluto
Qualitative data analysis

Data presentation and result, how a qualitative data analysis job looks like.at a glance. final output after analyzing using Atlas to ...

0:30
Qualitative data analysis

4,711 views

2 years ago

CS50
CS50R - Lecture 5 - Visualizing Data

This is CS50, Harvard University's introduction to the intellectual enterprises of computer science and the art of programming.

1:15:32
CS50R - Lecture 5 - Visualizing Data

11,113 views

1 year ago

IUT Business and Technology Management
Generative AI and Data Visualization: Turning data into compelling visuals.

Drowning in data but struggling to make it tell a story? See how Generative AI transforms complex data into clear, compelling ...

3:11
Generative AI and Data Visualization: Turning data into compelling visuals.

200 views

10 months ago

Promind AI
This is how you turn data into art with ProMind #microsoft #tech #office #aitools #ai

ProMind AI let's you plot graphs and various other visualisations for your data.

0:10
This is how you turn data into art with ProMind #microsoft #tech #office #aitools #ai

559 views

1 year ago

Thinkmetrics
Productive morning routine of a data analyst #dataanalyst #notion
0:30
Productive morning routine of a data analyst #dataanalyst #notion

829 views

1 year ago

CS50
CS50R - Lecture 2 - Transforming Data

This is CS50, Harvard University's introduction to the intellectual enterprises of computer science and the art of programming.

1:38:25
CS50R - Lecture 2 - Transforming Data

21,243 views

1 year ago

Visme
My Favorite Graph Maker Tool

... charts, analytics reporting and it makes my data look SO good. #dataanalytics #datavisualization #dataviz #infographics #graph ...

0:11
My Favorite Graph Maker Tool

961 views

1 year ago

Worlds stats
How MrBeast Broke YouTube: 10 Years of Subscriber History Visualized

Watch this dynamic data visualization track the Top 10 most subscribed channels in the world from 2015 all the way to 2025.

4:02
How MrBeast Broke YouTube: 10 Years of Subscriber History Visualized

43 views

1 month ago

Brenton Piercy
Cheaper Boat Data Visualization. Pt. 1

Trying to get all the data that's on my boat into a clean easy spot to view and log. Here I show the new touchscreen from adafruit ...

3:39
Cheaper Boat Data Visualization. Pt. 1

301 views

2 years ago

Tracy Wanjera
Data visualization using Excel.

Using Excel to combine two datasets and perform data visualization.

4:09
Data visualization using Excel.

6 views

1 year ago

TrishNiftyArt
Data Visualization and the Role of Artists

Prof Trish Gianakis Nov 2024 explains : Why Artists are Essential: Artists make complex data accessible, compelling, and ...

31:03
Data Visualization and the Role of Artists

15 views

1 year ago

Alex The Analyst
#DataAnalystSalary #DataAnalysis

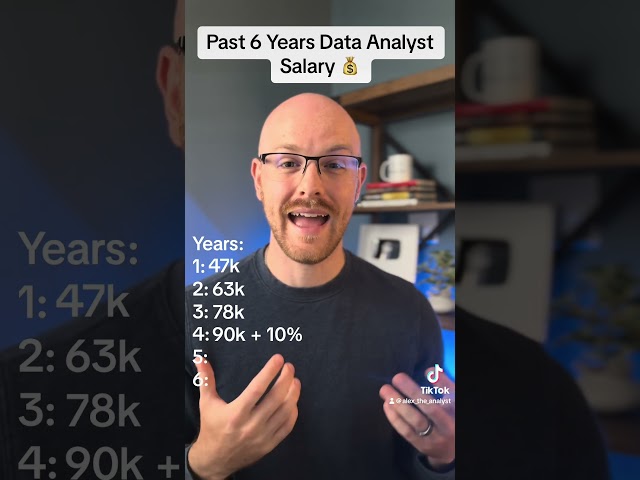
Right so let's go through my salaries over the past six years as a data analyst my very first job as a data analyst was that a ...

0:54
#DataAnalystSalary #DataAnalysis

57,478 views

2 years ago

Alex The Analyst
Do you need to learn SQL if you can do everything in Python?  #Python #dataanalysis #SQL

... Data Analysis Specialization - https://coursera.pxf.io/AoYOdR Tableau Data Visualization - https://coursera.pxf.io/MXYqaN ...

0:51
Do you need to learn SQL if you can do everything in Python? #Python #dataanalysis #SQL

75,794 views

2 years ago

The Data Girl
Power BI Dashboard | Cafe Sales Data | End-to-End Data Analysis

... data analytics project, Power BI tutorial, Power BI beginner project, sales dashboard Power BI, Power BI data visualization, cafe ...

25:38
Power BI Dashboard | Cafe Sales Data | End-to-End Data Analysis

986 views

2 months ago

Visual Analytics
Syracuse data viz Linkedin
0:37
Syracuse data viz Linkedin

2 views

2 years ago

Knock Out Data Insights
Power BI #WOW2024 W39: Creative data visuals & design

For more information on the Workout Wednesday challenge, go to: https://workout-wednesday.com/pbi-2024-w39/

22:58
Power BI #WOW2024 W39: Creative data visuals & design

88 views

1 year ago