Upload date
All time
Last hour
Today
This week
This month
This year
Type
All
Video
Channel
Playlist
Movie
Duration
Short (< 4 minutes)
Medium (4-20 minutes)
Long (> 20 minutes)
Sort by
Relevance
Rating
View count
Features
HD
Subtitles/CC
Creative Commons
3D
Live
4K
360°
VR180
HDR
6,616 results
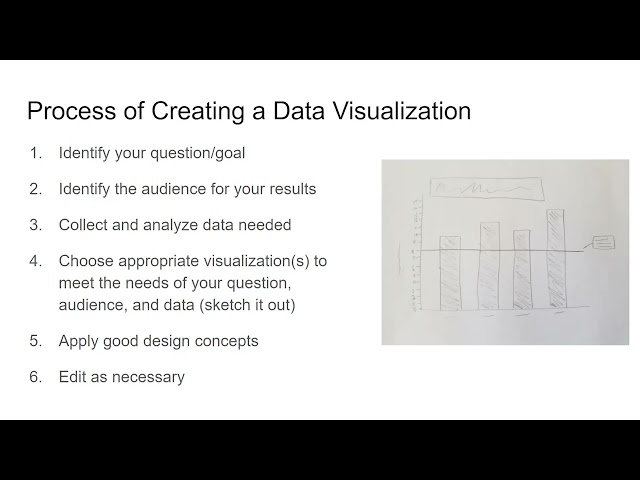
Presented by Alisa Rod. This video is part of a series of lectures recorded to teach about basic data visualization concepts.
354 views
4 years ago
Presented by David Christensen. This video is part of a series of lectures recorded to teach about basic data visualization ...
318 views
The data visualiser application allows the user to generate various charts directly within DHIS2. The Data Visualiser tool follows ...
10,267 views
7 years ago
... Katrina and Tim dive into the key differences between Sigma and Tableau, two leading data visualization tools. Katrina recounts ...
8,039 views
1 year ago
Test our community for 7-days trial: https://surfalytics.com/ Visit our GitHub repository: https://github.com/surfalytics Join Dmitry ...
174 views
Let's talk about Data Visualization! We've been hearing this expression a lot lately, but do you really know how to put your data in ...
180 views
A short film describing the development of a prototype application for the Oculus Rift DK2 headset, to visualise subsurface ...
8,075 views
11 years ago
A short introduction to the core concepts of data visualization and their application to network biology. The presentation provides a ...
4,680 views
Presented by Tess Grynoch. This video is part of a series of lectures recorded to teach about basic data visualization concepts.
29 views
Featuring Dr. Radovan Bast from UiT the Arctic University of Norway, this video is a part of the DocEnhance Course on Data ...
299 views
2 years ago
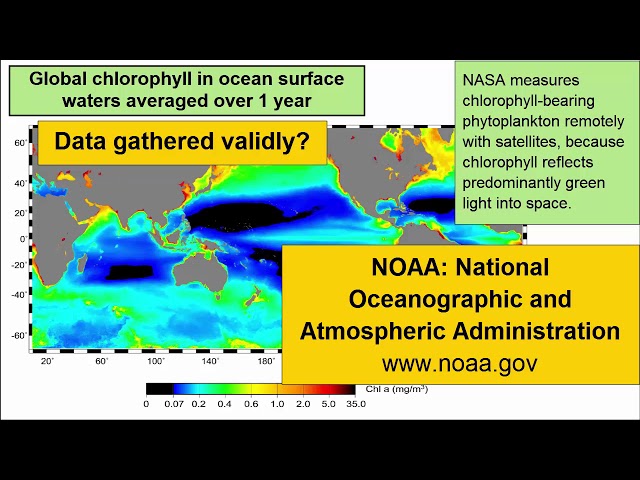
For an introductory college-level earth sciences class: a review of how to read and critically evaluate data visualizations such as ...
9,104 views
8 years ago
102 views
This tutorial delves into the foundational tools (e.g., Matplotlib, Seaborn, Pandas)for data visualization in Python. We'll explore bar ...
600 views
170 views
Presented by Angela Zoss. This video is part of a series of lectures recorded to teach about basic data visualization concepts.
60 views
Learn about the Data Science Pipeline with the National Student Data Corps! The fifth step in the Data Science Pipeline is Data ...
235 views
Hello everyone! In todays video I want to show you how you can use Obsidian for data visualization by using Obsidian Charts, ...
26,847 views
313 views
Introduction to network analysis and visualization with GEPHI. Datasets and tutorial here: ...
113,951 views
3 years ago
105 views