Upload date
All time
Last hour
Today
This week
This month
This year
Type
All
Video
Channel
Playlist
Movie
Duration
Short (< 4 minutes)
Medium (4-20 minutes)
Long (> 20 minutes)
Sort by
Relevance
Rating
View count
Features
HD
Subtitles/CC
Creative Commons
3D
Live
4K
360°
VR180
HDR
158,200 results
AD: Sign up to enroll for a 7-day free trial with Coursera now!
3,151,438 views
3 years ago
Learn Excel in just 2 hours: https://kevinstratvert.thinkific.com In this step-by-step tutorial, learn how to pull together charts in Excel.
1,317,271 views
2 years ago
Get our Excel Course here: https://www.careerprinciples.com/courses/excel-for-business-finance DOWNLOAD Free Excel file ...
520,331 views
Try think-cell for free: https://tinyurl.com/xelplus Create professional business charts in Excel—start here ...
630,361 views
... DOWNLOAD Free Excel file for this video: https://view.flodesk.com/pages/63dd44d5781752946ff2af78 In this video we'll build a ...
1,788,428 views
https://other-levels.com/products/one-time-full-access The #1 Website Worldwide for Excel Dashboard Templates, Reports, ...
6,417,014 views
4 years ago
Sign up for our Excel webinar, times added weekly: https://www.excelcampus.com/blueprint-registration/ PART 1: ...
15,319,475 views
11 years ago
Build an interactive Excel dashboard for better data visualization in less than 20 minutes. ❗Master Excel with my courses: ...
78,603 views
1 year ago
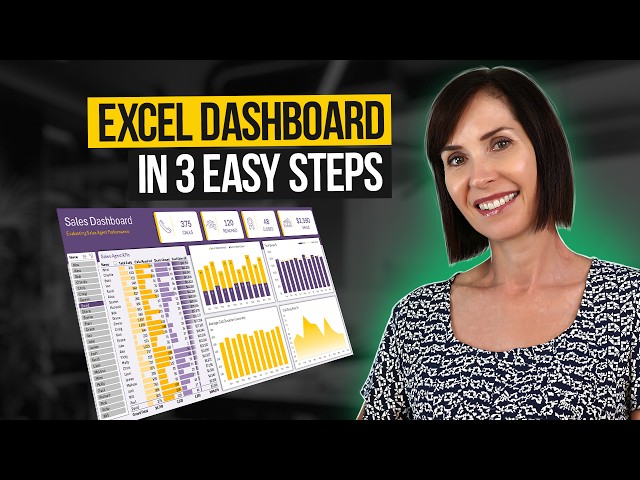
In this step-by-step tutorial, learn how to create dynamic and interactive Excel dashboards. With a dashboard, you can showcase ...
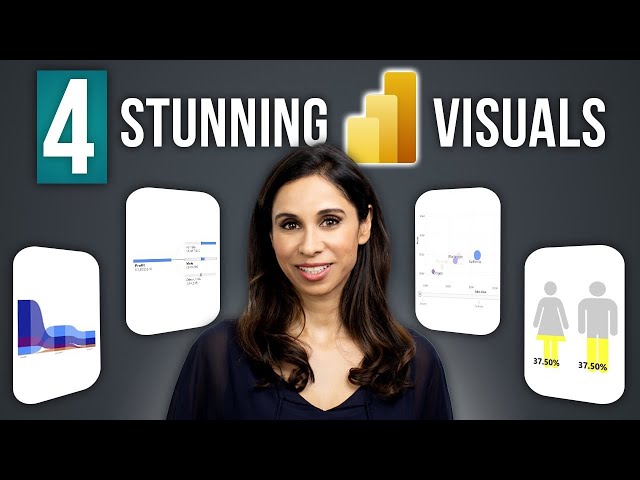
3,633,672 views
Join our popular FREE Power BI beginners course today https://link.xelplus.com/yt-d-visuals-powerbi-starter Dive into the world ...
556,177 views
Create charts that wow your audience. Learn the secrets now—start today! https://link.xelplus.com/yt-g-basics-charts-course ...
1,193,410 views
8 years ago
Ready to transform your spreadsheets from ordinary to extraordinary? In this tutorial, you'll learn how to take raw, unorganized ...
134,942 views
Links mentioned in this video ⬇️ Exercise File ...
252,388 views
Create charts that wow your audience. Learn the secrets now—start today! https://link.xelplus.com/yt-g-org-charts-course ...
811,541 views
6 years ago
In this video, I show you step-by-step how to turn your data into meaningful insights without using any complicated formulas.
441,575 views
Create charts that wow your audience. Learn the secrets now—start today! https://link.xelplus.com/yt-g-survey-charts-course ...
296,881 views
How to Make Interactive Excel Dashboards & ONE CLICK Update. Master Excel now with 20% off all courses until Feb 15, ...
327,878 views
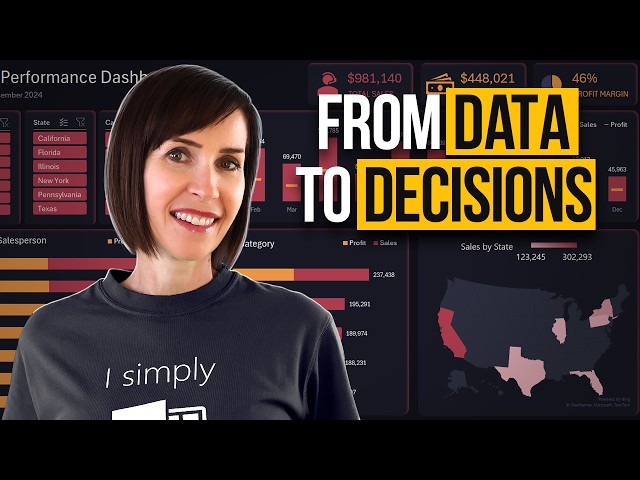
In this video will learn data cleaning, processing, analysis and dashboard creation in Excel. Complete data analytics project ...
1,453,096 views
How to insert slicers and timelines into your pivot tables in Excel to filter data. Learn how to enhance your Excel pivot tables by ...
11,418 views
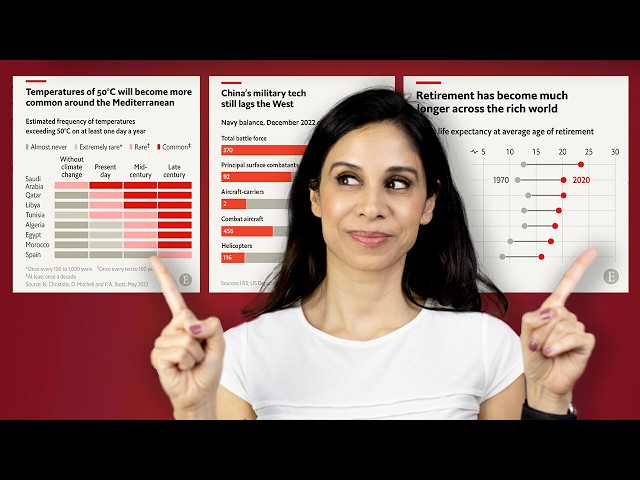
Data Visualization often means creating graphs and charts that tell a compelling story - a story that captures the audience's ...
224,231 views