ViewTube

ViewTube
Sign inSign upSubscriptions
Filters

Upload date

Type

Duration

Sort by

Features

Reset

34,356 results

Chandoo
The Ultimate Excel Dashboard: Visualize Data Like a Pro

OFF My Dashboards Course (code: SAVE50) https://chandoo.org/wp/excel-school-program/ ~ Become an Excel Dashboard ...

29:50
The Ultimate Excel Dashboard: Visualize Data Like a Pro

116,236 views

5 months ago

Gurru Tech Solutions
Nano Banana + Gemini 3: AI Data Visualization That Actually Works

Nano Banana + Gemini 3: The Data Visualization Workflow You Need | Stop Making Boring Charts – Use This Nano Banana + ...

10:14
Nano Banana + Gemini 3: AI Data Visualization That Actually Works

25,939 views

4 months ago

Simon Sez IT
How to Create Data Visualization in Excel using Tables, Slicers and Charts (Includes Free Files)

Download the free course files and follow along here: ...

46:13
How to Create Data Visualization in Excel using Tables, Slicers and Charts (Includes Free Files)

3,074 views

4 months ago

Excel Campus - Jon
Google's New AI Creates Dashboards at INSANE Speeds

Save 75% on our AI Literacy for Excel Course during Black Friday/Cyber Monday ...

9:22
Google's New AI Creates Dashboards at INSANE Speeds

98,869 views

4 months ago

Excel Visual
How to Make a Personal Finance Dashboard in Excel for Expense Management

Managing your personal finances becomes much easier when you can clearly see where your money goes each month.

1:40:09
How to Make a Personal Finance Dashboard in Excel for Expense Management

54,394 views

5 months ago

Data Universe
Finance Dashboard in Excel | Complete Financial Reporting & Analysis Dashboard

In this video, we have explained how to create a complete Finance Dashboard in Excel — a dynamic and ready-to-use financial ...

27:49
Finance Dashboard in Excel | Complete Financial Reporting & Analysis Dashboard

20,119 views

5 months ago

Manus AI
Introducing Data Visualization for Manus

Introducing Data Visualization for Manus! Say goodbye to spreadsheet chaos. Whether you're analyzing competitors, prepping for ...

0:42
Introducing Data Visualization for Manus

18,629 views

8 months ago

Excel Bee
Interactive dashboard in excel | Excel data visualization dashboard

Download Dataset and Icons Set: https://www.theexcelbee.com/p/download-sales-dataset-with-icons.html Excel/Power BI ...

58:46
Interactive dashboard in excel | Excel data visualization dashboard

723 views

4 months ago

Satish Dhawale
How to Create Dynamic Target vs Actual Chart in Excel | Excel Data Visualization Tutorial

How to Create Dynamic Target vs Actual Chart in Excel | Excel Data Visualization Tutorial #SD79 Satish Dhawale Sir has ...

36:16
How to Create Dynamic Target vs Actual Chart in Excel | Excel Data Visualization Tutorial

15,797 views

8 months ago

Kenji Explains
NEW Claude in Excel: How Good Is It?

Testing how well Claude for Excel performs in data cleaning, financial modeling, and more! Take our Complete Finance ...

15:00
NEW Claude in Excel: How Good Is It?

172,720 views

2 months ago

Vedakarna
HR Analytics Management Dashboard in Excel 📊—Step-by-Step Tutorial

Join Our Community: WhatsApp: https://whatsapp.com/channel/0029VbCIu9XHVvTSpnBDWr0e Telegram: ...

45:13
HR Analytics Management Dashboard in Excel 📊—Step-by-Step Tutorial

36,036 views

4 months ago

Ms Excel
Create Professional Excel Dashboard in just 10 Minutes || Interactive & Dynamic #excel #dashboard

We're bringing you the best Excel tips and tricks to help you become a spreadsheet expert! Don't forget to hit that like button to ...

13:40
Create Professional Excel Dashboard in just 10 Minutes || Interactive & Dynamic #excel #dashboard

440,770 views

6 months ago

Spreadsheet Power
Create Infographics form Excel Data | Data Visualization and Analysis Made Easy!!

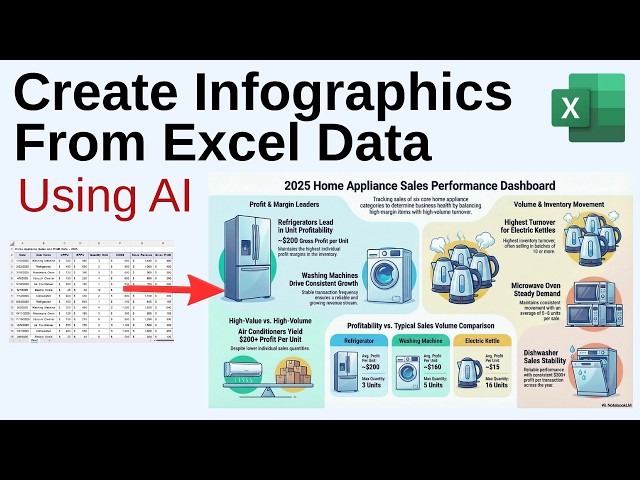
Learn how to create infographics form Excel data. This amazing AI tool turns your data into powerful and insightful infographic ...

4:42
Create Infographics form Excel Data | Data Visualization and Analysis Made Easy!!

142 views

9 days ago

Jeff Su
Master Data Analysis with ChatGPT (in just 12 minutes)

Coursera Data Analysis course (40% off for 3 months): https://imp.i384100.net/c/2464514/3102764/14726 Learn how to analyze ...

11:54
Master Data Analysis with ChatGPT (in just 12 minutes)

350,045 views

8 months ago

Christine Jiang
Data Storytelling 101 | Think Like a Data Analyst

MENTORSHIP – Applications for the March 2026 cohort are now open! Apply here → https://theanalyticsaccelerator.com/ We're ...

12:55
Data Storytelling 101 | Think Like a Data Analyst

55,069 views

1 year ago

Accounts Expert
Excel Mastery in 90 Minutes | Complete Excel Course in One Video

Learn Microsoft Excel from basics to advanced in just 1 hour 32 minutes. This complete Excel course covers formulas, functions, ...

1:32:23
Excel Mastery in 90 Minutes | Complete Excel Course in One Video

173,142 views

6 months ago

Excel Dictionary
Never Before Seen Excel Data Visualization Trick

This amazing Excel trick will blow your mind! In this video, I'll show you how to create stunning bar charts using nothing but the ...

1:45
Never Before Seen Excel Data Visualization Trick

3,732 views

7 months ago

The Wular Academy
PYTHON IN EXCEL: Data Analysis & Visualization with Pandas & Seaborn.

See how Python is transforming Excel into a data powerhouse. In this video, we'll demonstrate: • The groundbreaking PY function ...

22:00
PYTHON IN EXCEL: Data Analysis & Visualization with Pandas & Seaborn.

6,893 views

10 months ago

Dr. Asif’s Mol. Biology
Best Free Data Visualization Tool for Publication-Ready Graphs | RawGraphs.io Tutorial

Welcome to this video on RawGraphs.io, an open-source data visualization tool designed for everyone—from beginners to data ...

8:24
Best Free Data Visualization Tool for Publication-Ready Graphs | RawGraphs.io Tutorial

2,022 views

10 months ago

Derek Cheung | AI Agents Automation
Automate Data Analysis with AI: No Code CSV to Reports in Minutes (n8n + Claude + Hostinger)

... #BusinessAutomation #ProductivityHacks #CSVAnalysis #AISkills #WorkflowAutomation #TechTutorial #datavisualization.

15:07
Automate Data Analysis with AI: No Code CSV to Reports in Minutes (n8n + Claude + Hostinger)

23,188 views

5 months ago